rampspot — Smart Marketing Advisor for small businesses to grow online

Problem statement
Small businesses struggle in growing their businesses themselves online due to lack of knowledge, too many solution providers and doubt about what strategy is best for them at the present moment that would endure best results in affordable costs.
Problem areas
Don’t know how to best grow their digital presence.
Difficult to know what’s the right action at the right time.
Understanding of SEOs, marketing channels, analytics is low.
Confusing landscape of tools, services & marketing channels.
Not sure on what online presence metrics to focus on to drive more revenue.
Not sure what would be the ROI if they spend money of them.
Product Opportunity
Build a Simple to understand & easy to use Marketing tool that analyses a business’s existing web & social presence and provides step by step personalised recommendations to market & grow their businesses better online focusing on 3 key areas for improvement that are Reach, Engagement & Growth.

User Persona
Karren has always been passionate about fashion and pursued to go to a fashion school, worked for 2 years in the industry and started her own venture with her mom managing the store by opening a fashion boutique.
She mostly sells her products offline and gets a few orders online from facebook, instagram as she heavily posts her creations online and relies on approvals of her friends and communities to maintain a decent visibility and appreciation of her work.
Online activities pertaining to business 1. Attended an art and fashion exhibition 2. A rare visit of a local celebrity friend who bought something from her store 3. Maintains a blog on fashion on facebook 4. Keeps posting photos of herself with new apparels and accessories designed by her and other fashion designers.
Profession Has a Fashion outlet who sells apperals and accessories
Tech skills: Average Online seen - 3-4 hours daily, Always active on FB n whatsapp Sites he visits: Facebook, reads blogs, youtube, instagram, pinterest
Devices she uses: Web and Mobile both
Internet presence: Website Social business page on facebook Twitter presence Instagram Pinterest Chat engines - whatsapp
Marketing knowledge: facebook analytics Digital marketing on social media
User Journey

Scenario
Karren uses rampspot to gather web, social and local insights and get immediate actions to work on for improvement of her online business presence, engagement and growth.
Onboards
Karren likes the value prop of rampspot and registers herself by linking her online profiles: - Her business website - Social media - Local listing
Data Analysis
Rampspot starts analysing Karren’s website, social media page and local listings and gathers all the relevent data needed for each module.
Competitive analysis
Based on users website and social media, a list of competitors are identified of Karren’s business. and all the same data metrics are captured for them for comparison.
Reporting
A report is being build for web, social and local scores and with relevent metrics for users disposal.
Key metrics: Web: Performance , Responsive, Security Social: Followers, Post frequency, Quality of engagement Local: Presence, SEO, Reviews
Personalised Recommendations
Ramspot gathers metrics and starts to build a list of To Dos or Recommendations that a business owner can do and benefit from.
Each action would result in change in metrics over time and the result of those actions can be monitored.
User Experience
Pre-Launch
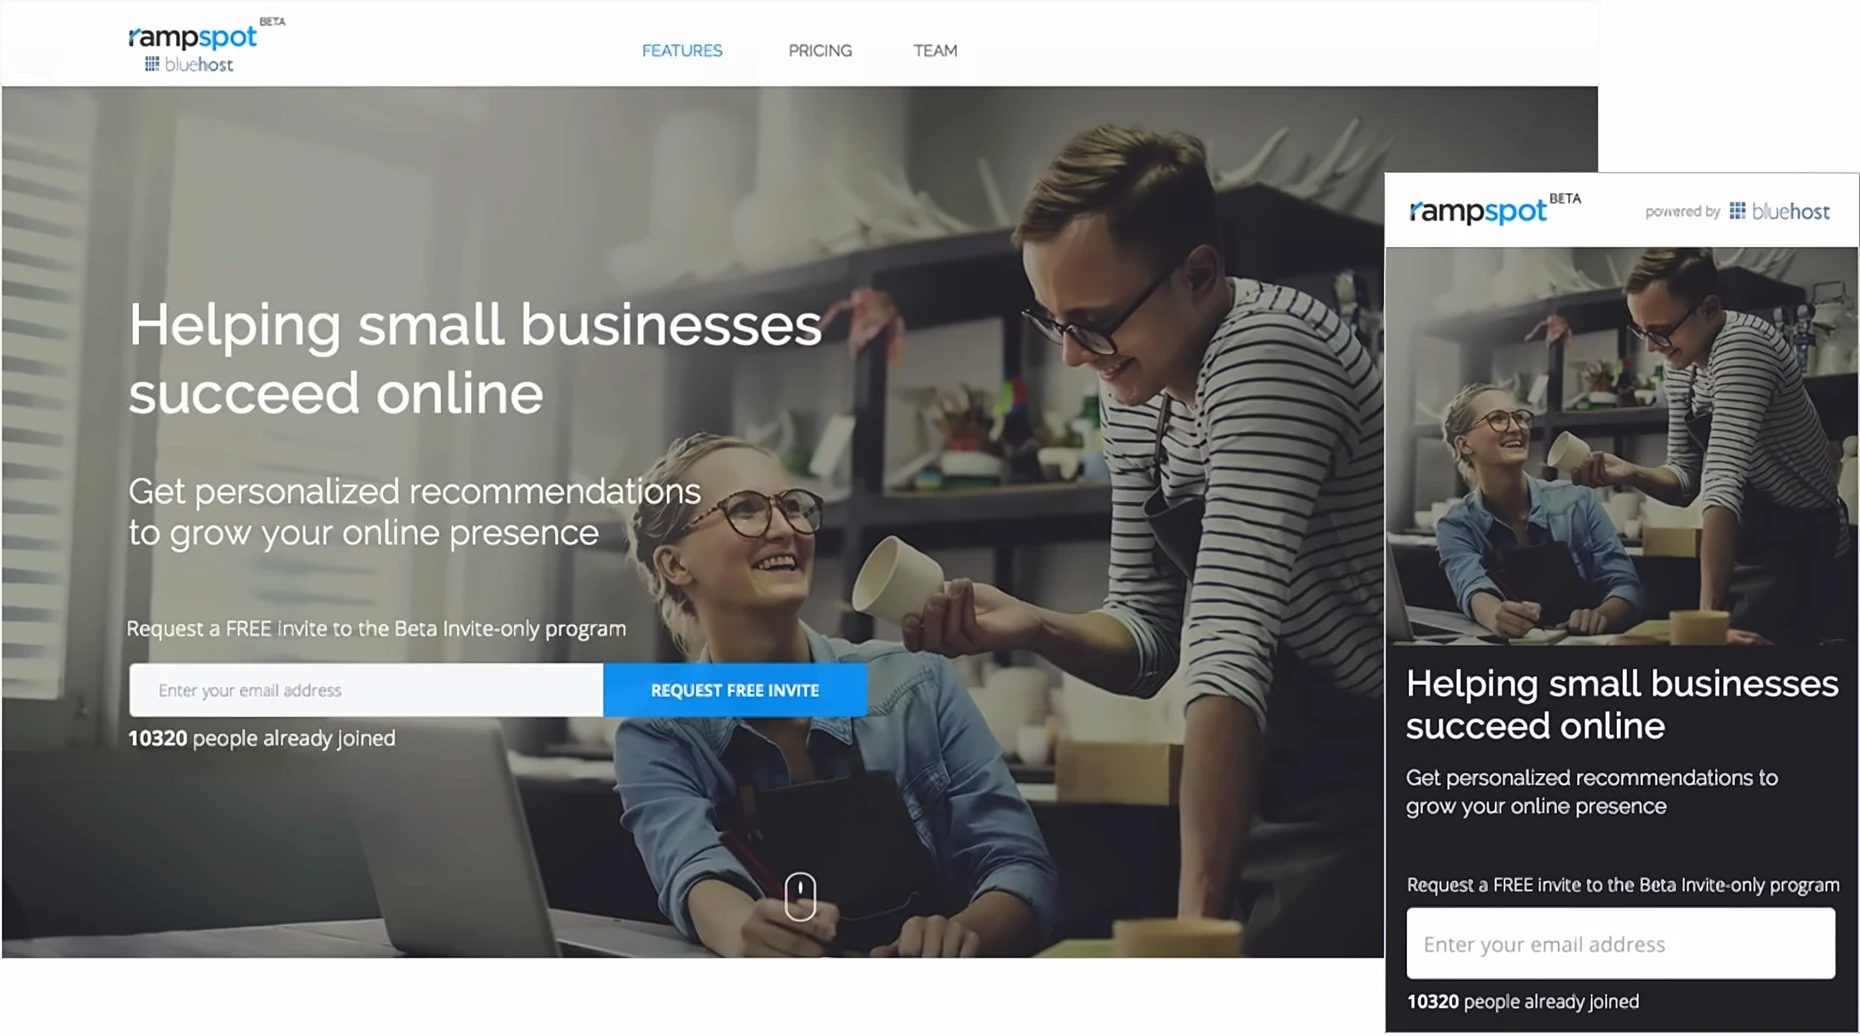
Rampspot’s Pre-launch campaign was designed to create anticipation among users about the product and give benefits to members who would participate in referral program and invite more users and win prizes like cheaper membershp plans.
The marketing page was an invite only program accessible for those who opt for registering and become early members to use rampspot.


Dashboard
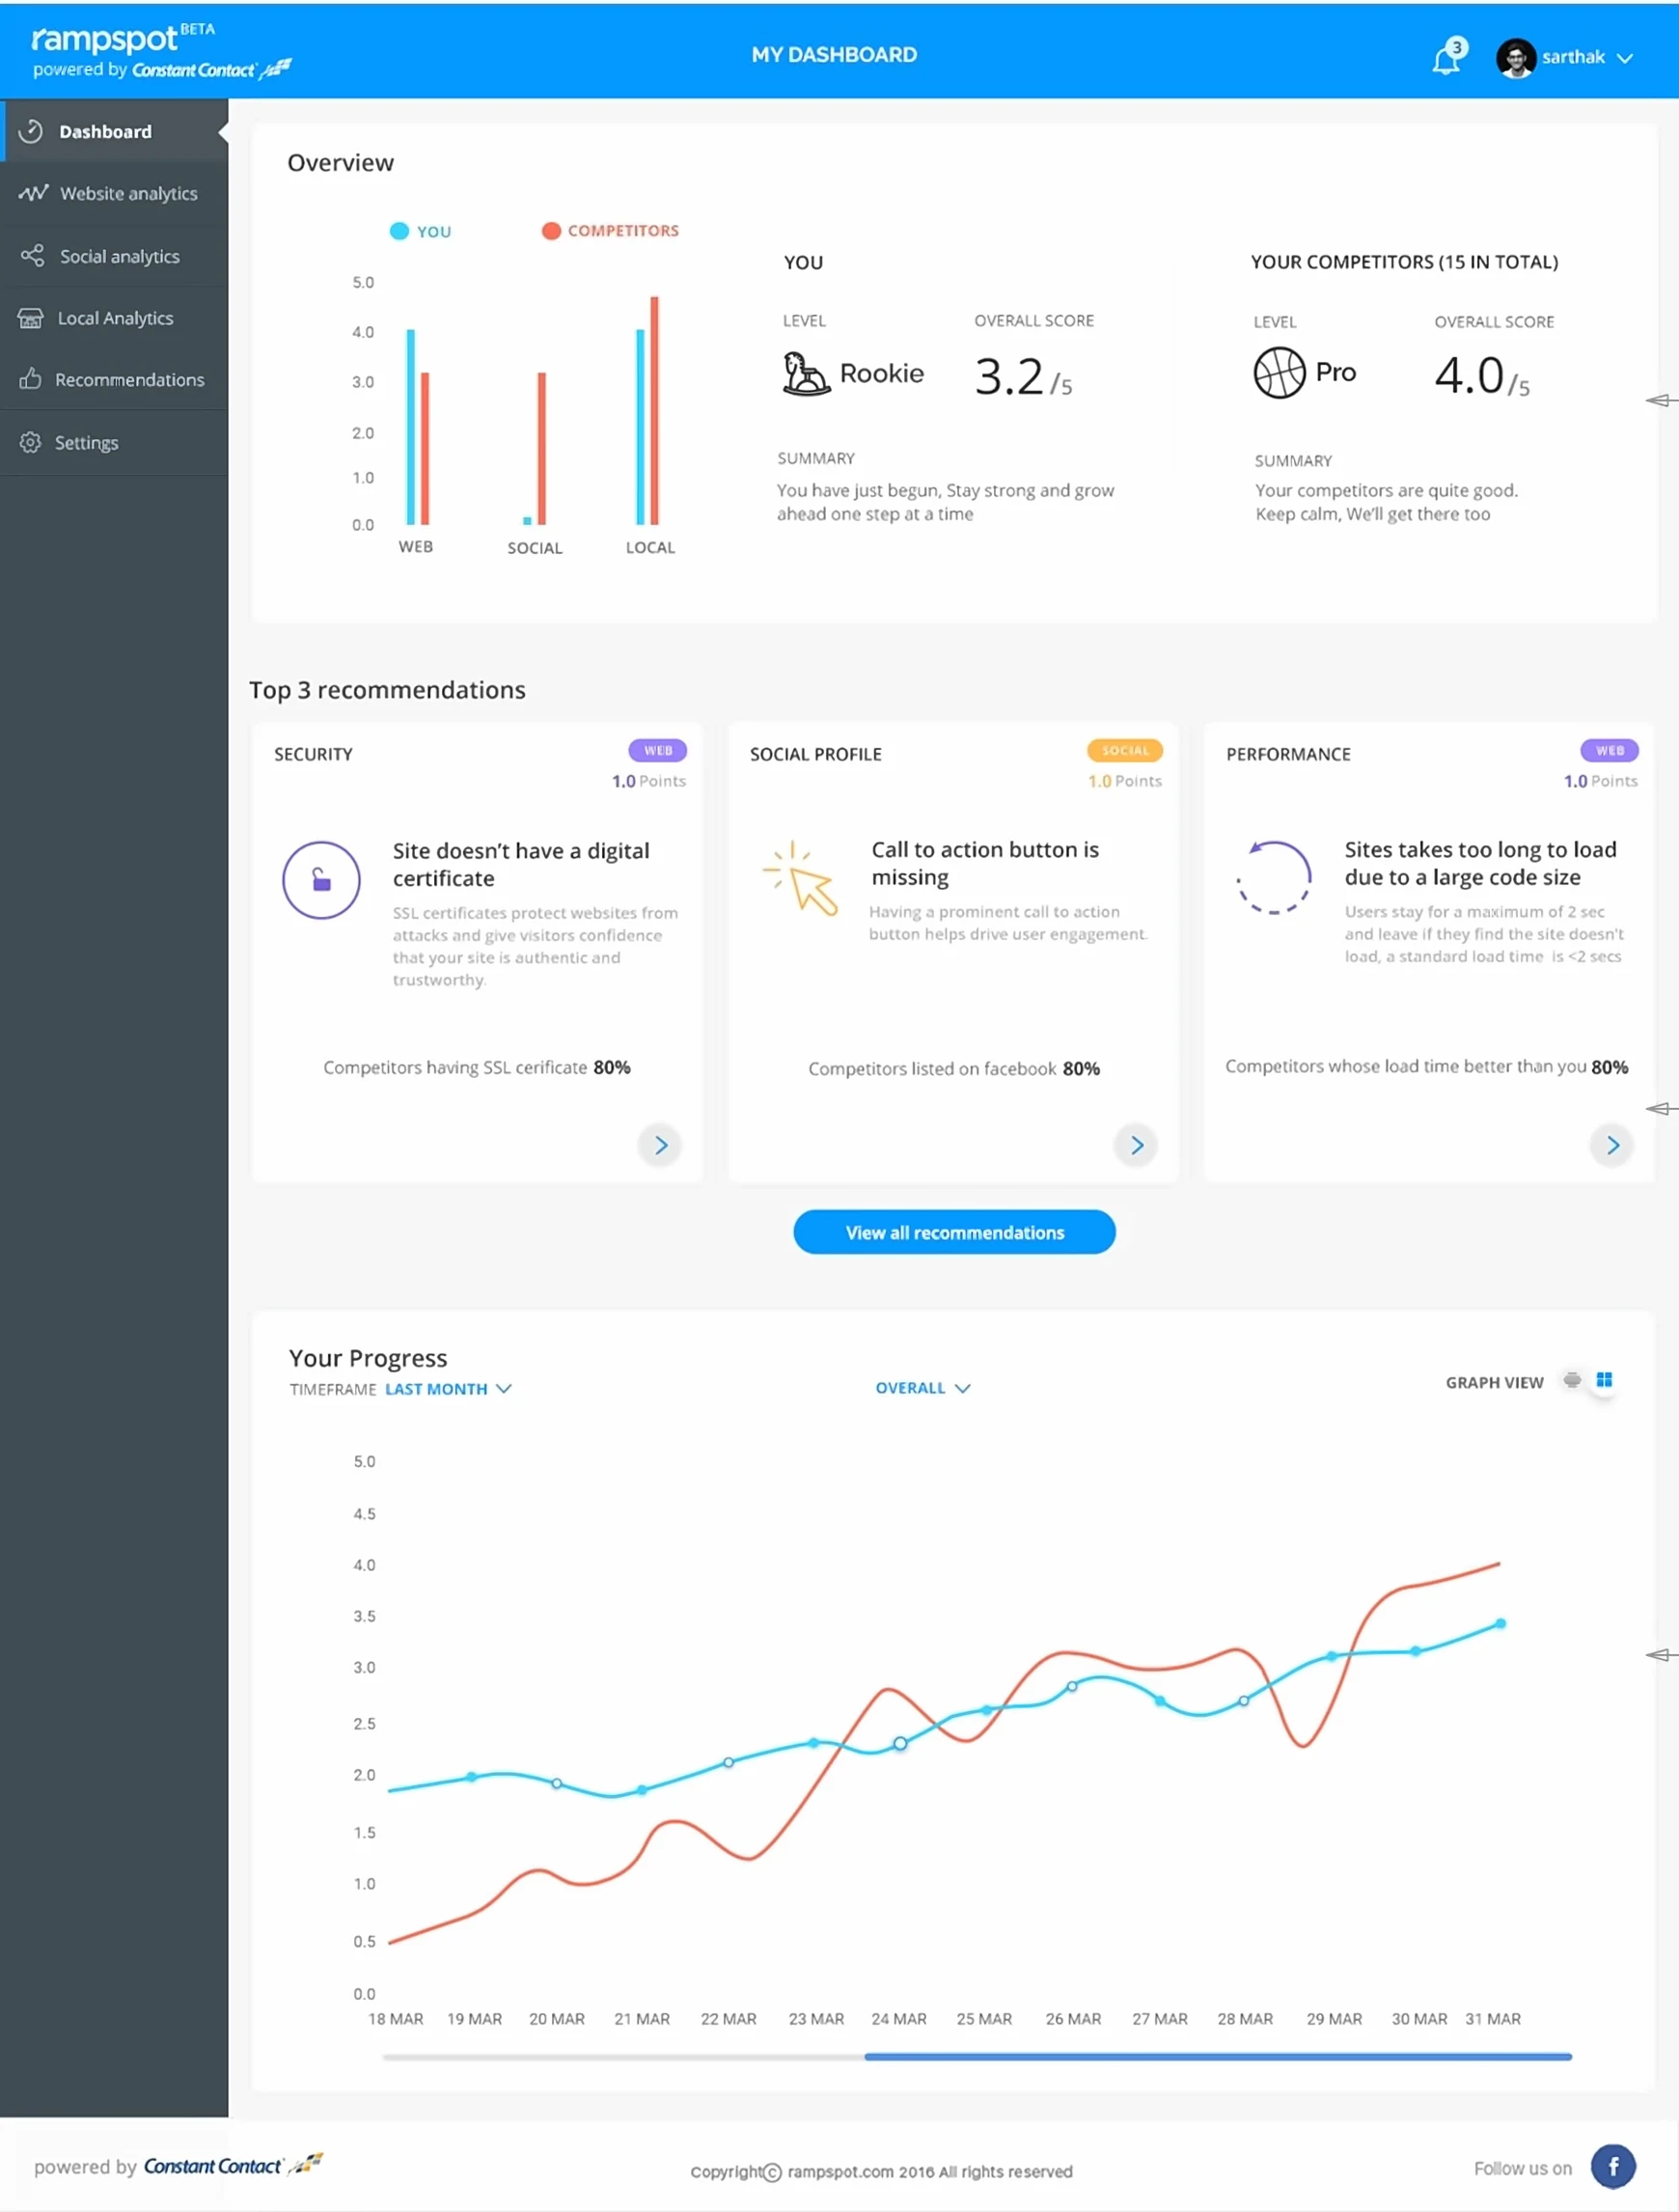
The main page of Rampspot was the dashboard on which the summary of all the analytics was layed out for users to consume in a simple manner.
Overview
This metrics gives a score to the user as per how their business is doing in 1. Their web presence - Website 2. Social presence - Social media 3. Local presence - Local listings like Yelp, Yellowpages
The same data points are calculated for the business’s competitors and the scores and metrics of each category (Web, social and local) are compared with the business’s metrics.
Recommendations
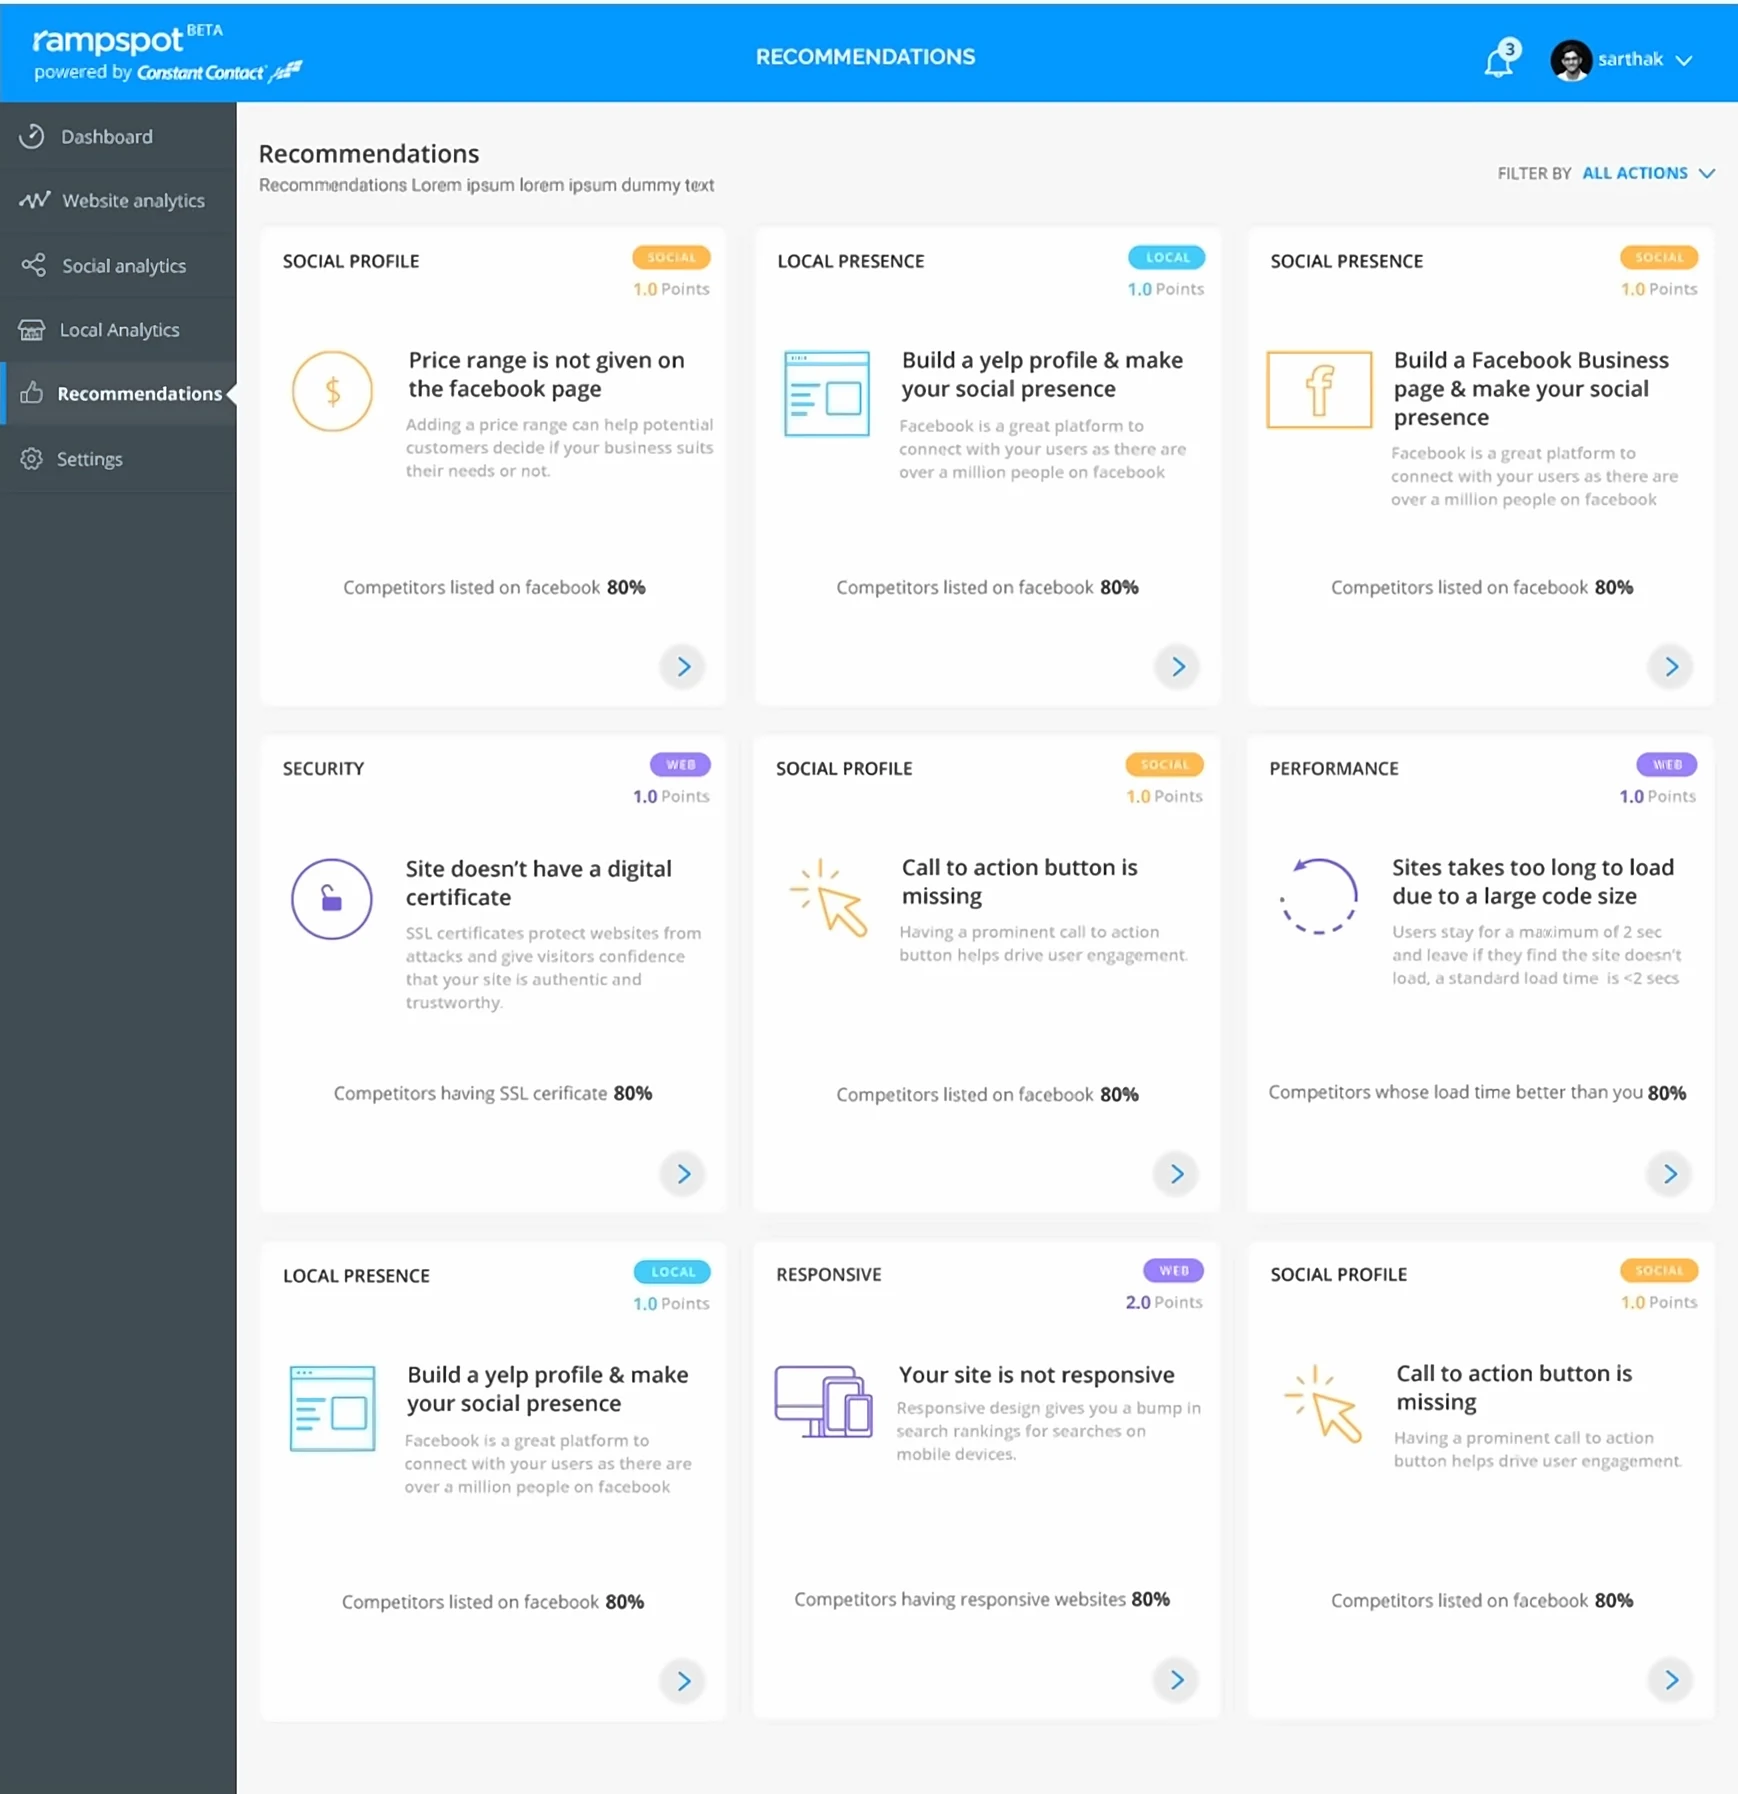
Recommendations section provides users with the most important recommendations that they should be doing in order to increase their business growth.
e.g. A simple recommendation for improving a website could be - Optimize images and javascript for your site.
Progress graph
Progress graph shows how you are scoring with respect to your competitors over time. Users can see the actions that increased their score over their competition.

Social Analytics
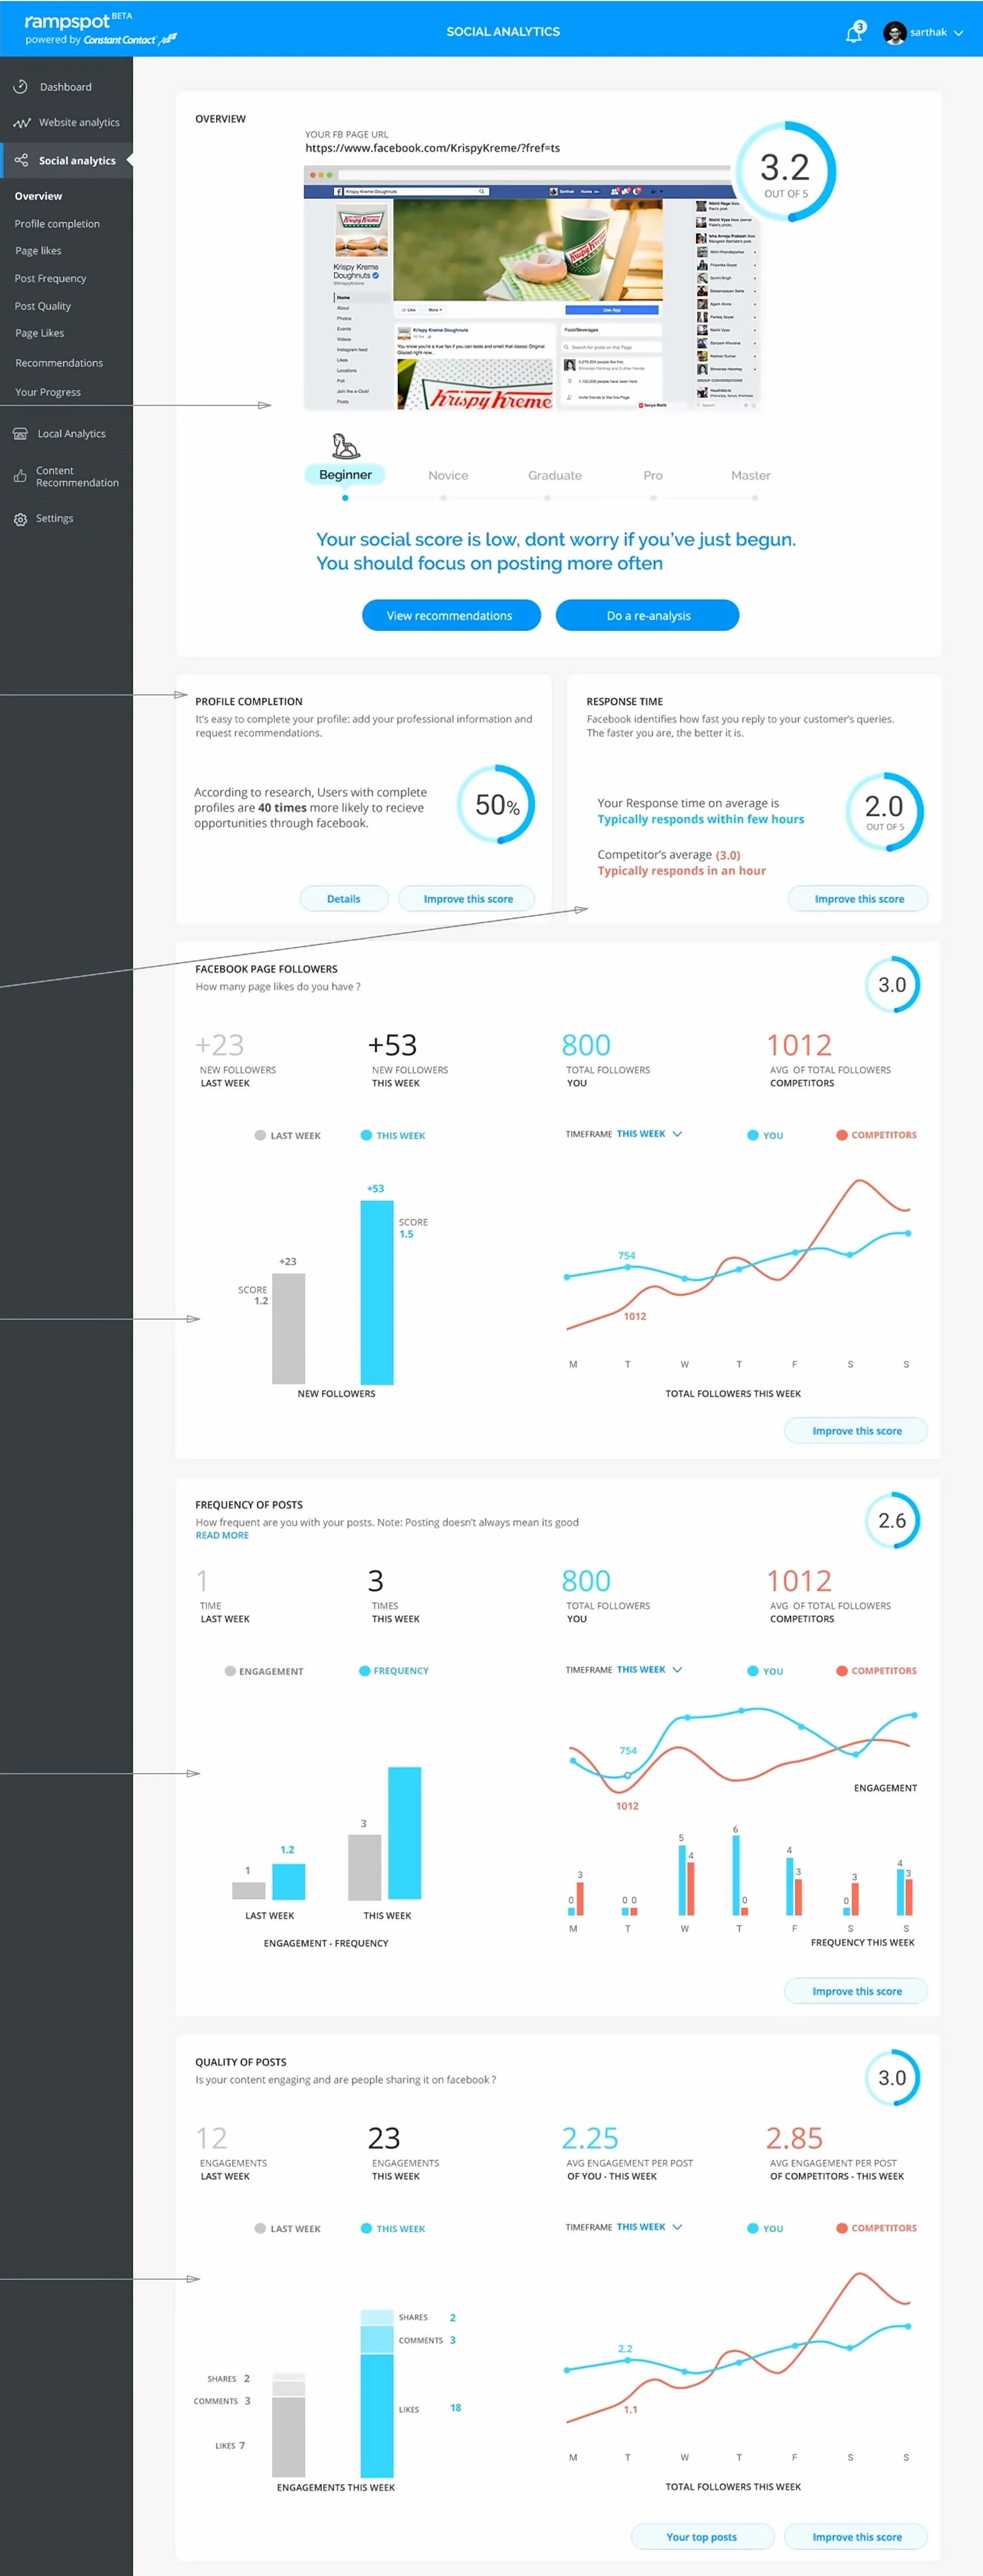
Social Analytics page analyses the social score of the business by identifying some key metrics that define how well the social media page of the business is performing.
Rank
Social rank and score determines how well the social page is doing by quantifying ley metrics like number of users visiting the page each week, engagement metrics like likes, shares, comments on posts, how frequent the business owner is in posting relevent content to engage with his users.
Profile completion
A complete profile lets users to engage with your page and content. This feature helps users to fill necessary information on their page that may interest the business’s audience. e.g. Business hours, About the business, contact details etc.
Response time
This features scores the business as per the frequency of replying back the user in comparison with the competetion. User can improve this score by following the recomendation.
Page followers
Page followers is the metrics that shows the growth rate of the users following the business page. The graphs describe new users following the page this week to last week and Total followers vs competiton.
Frequency of posts
The frequency of posts is an important metrics to capture in order to keep your audience engaged with your content. The graphs depict the frequency of posts mapped with user engagement. If the engagement is low, users can improve this score by following recommendations like increase post frequency, select the relevent content for engagement.
Quality of posts
The Quality of posts detrmines whether users are liking the content the business is sharing and what are the like, share, comment metrics in time. The scores are comparable with competitor’s and can be improved by following recommendations.

Website Analytics
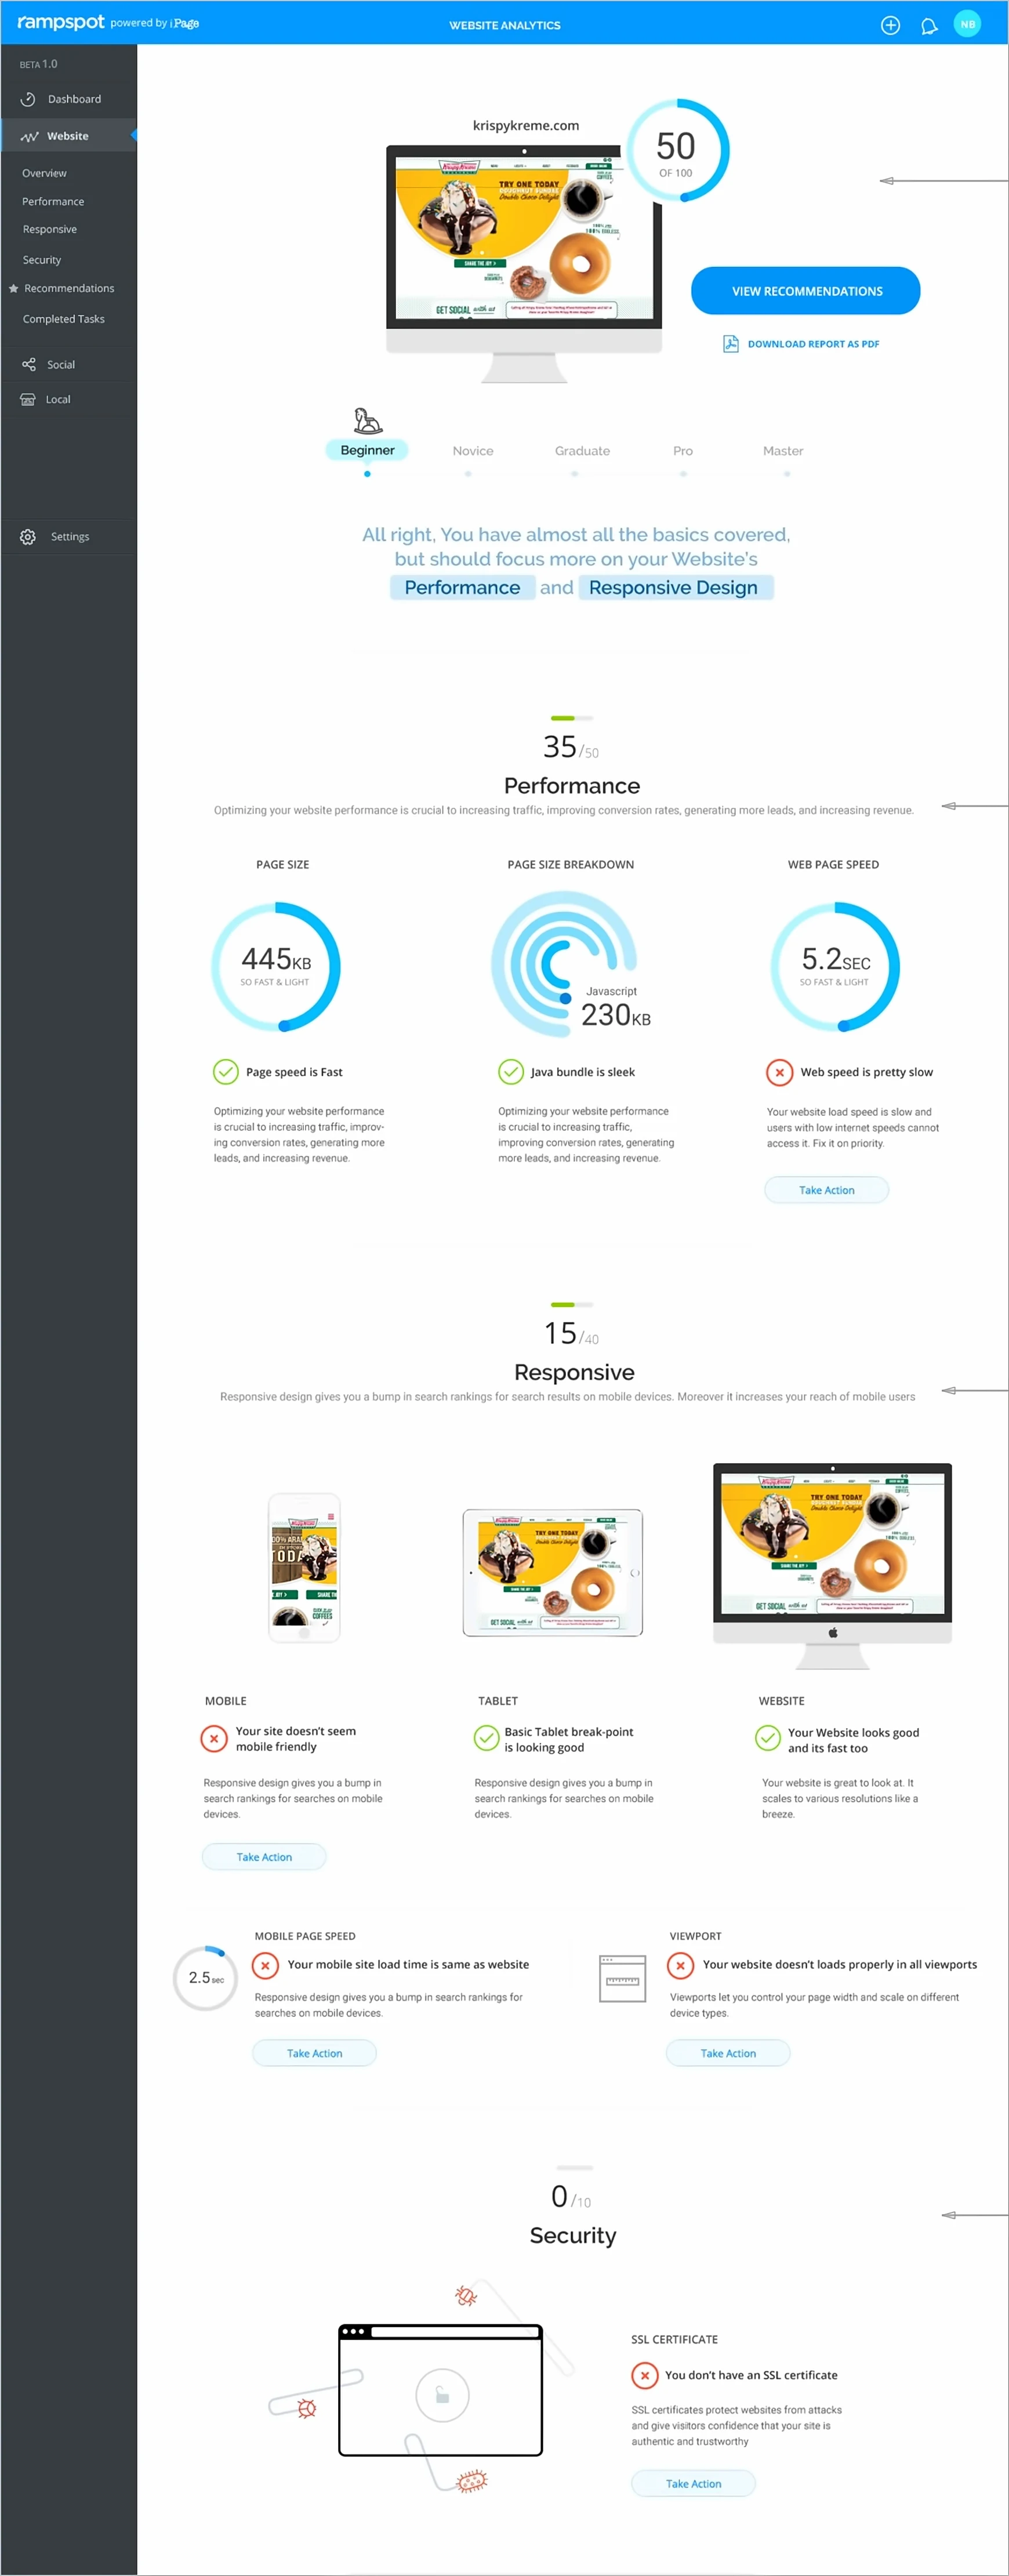
Business owner can use web analytics feature to view where they stand on the chart. A rank is provided and metrics supporting how their website is being ranked but most importantly, personalized recommendations on improving the website score.
Performance metrics
Performance of the site determines how fast and easily the business’s website opens and its content gets accessible to the users. The metrics include Page size & speed to load the page. The ttempt is to optimize the code such that the site becomes light and loads as fast as it can.
Responsive metrics
Responsive design means a website can be opened on any device and the content adjusts and scales to have a easy to use experience for that device. Most of the sites aren’t responsive and require users to pinch and zoom into content and commit actions.
This feature identifies how well the site has been designed to accomodate responsiveness for various device resolutions like mobile, tablet and web.
Security metrics
Website that aren’t SSL protected are subject to phising hacks and virus threats. This feature recognises whether the website is SSL protected and scores the website. If its not, User can take an action and buy an SSL certificate that secures the website instantly.
Recommendations
The Recommendations page consists of all web, social and local recommendations for users to take a look at and take action on as per their liking.
The list keeps refreshing after each action is completed.

THANK YOU
rampspot Smart Marketing Advisor · Product Design · 2017